Category Archives: Research In Progress

Guest lecture in Uppsala

Just back in Oslo from a guest lecture in Uppsala – at the department where I worked for several years and got my Ph. D. I was invited by the alumni organisation at the university to talk about some of my ongoing research regarding the 2018 Swedish election. Hopefully I’ll be able to present some of this research in a more formalised setting sooner rather than later.

Retweeting during the #val2014 Swedish Elections

While the previous post compared the overall uses of #val2010 and #val2014, two hashtags dealing with the Swedish elections of 2010 and 2014 respectively, the current post deals with the latter of the two elections. Specifically, I will offer an initial analysis of what users enjoyed the most popularity under the selected hashtag. While popularity on Twitter can certainly be defined and operationalized in a number of ways – number of followers, for instance – I would argue that the degree to which an account is retweeted in a consistent manner is a complimenting, if not even better measure. With this in mind, the network graph below, produced in Gephi, gives us an overview of who enjoyed plenty of retweets under the heading of the specified hashtag – and who appears to have been especially active in sending those retweets.

RTs-tweet_from-retweeted_by_force atlas-degree range 100

The graph (please click it to enlarge it) consist of a series of nodes, each representing an account. The larger the node, and the label identifying it, the more that particular user was retweeted. The darker red the color of the node, the more active that particular user had been at sending retweets. Moreover, using Gephi’s Force Atlas algorithm, the graph has been delimited to show only the top users in these ways. As such, many of the nodes (accounts) that contributed to the sizes of the other nodes have been omitted so as to only focus on those highly active users. The table below identifies some of the very top users in terms of receiving retweets for #val2014, and compares this distribution with that of the #val2010 hashtag. The latter of these two election hashtag was studied in this paper (pdf).

#val2010
Top Retweeted
N  Comments #val2014
Top Retweeted
N Comments
piratpartiet 1228 Pirate Party niklassvenson 9338 Journalist
Pihlblad 521 Journalist socialdemokrat 6302 Social democratic party
emanuelkarlsten 392 Journalist RebeccaWUvell 3643 Liberal debater, PR consultant
mickep2 335 Journalist Expressen 2426 Tabloid
SDopping 324 Journalist svtdinrost 2366 PSB election feature
danielswedin 318 Journalist jonssonjessica 2174 Anonymous
nikkelin 310 ITConsultant MXCartoons 1474 Anonymous, Immigration critic
Falkvinge 309 Politician, Pirate party ozznujen 1419 Comedian
annatroberg 307 Politician, Pirate party Pihlblad 1418 Journalist
UlfBjereld 305 Professor piratpartiet 1350 Pirate Party

The table shows how the dominance of journalists and Pirate party associates in 2010 appears to have been broken for the period leading up to the 2014 elections. Indeed, while the Pirate party account is featured also among the 2014 roster of high-end users, and while two journalists did indeed make their mark in this regard (niklassvensson and Pihlblad), the distribution for 2014 appears as more varied than for 2010. Much like for top @reply receivers discussed previously, we see media organizations (such as Expressen), rather than a multitude of journalists, emerge as successful in gaining retweets. Moreover, the presence of a well-known comedian – ozznujen – reflects another tendency identified by similar research, where celebrities gain leverage in online political discussions (see Larsson and Moe, forthcoming). Finally, two anonymous users succeeded in getting their tweets redistributed to high degrees in 2014. The person or persons behind the MXCartoons account provide a statement basically saying that the tweets will feature “common sense over political correctness”, which is instated by largely discussing and criticizing Swedish immigration policy. Perhaps more interestingly, the influence of the user jonssonjessica appears to have emanated from one tweet only. As in the case of the 2013 norwegian election, one such well-formulated and likewise timed tweet can gain attention – if ever briefly. Much like for the Norwegian case, this particular tweet was sent on election night – lamenting the fact that the incumbent liberal-conservative government appeared to have lost the popular vote. As such, while the comparably large node representing jonssonjessica might suggest an influential user, the placement of the node, relatively isolated from the others, suggest that this was largely a ‘one-off’.

Comparing Swedish Elections on Twitter – first impressions

As part of my collaboration with Hallvard Moe, we are now looking at data on Twitter use from the recently held 2014 Swedish elections. We are thus in a position to compare various aspects of Twitter use from two elections – 2010 and 2014. The table below features some of the overarching characteristics of the major hashtags employed for each election – #val2010 and #val2014.

Type of tweet #val2010

N (%)

#val2014

N (%)

Change

N

Undirected 60 088 (60.2) 89 747 (36.5) + 29 659
Retweet 32 780 (32.8) 146 487 (59.6) + 113 707
@replies 6 964 (7) 9 411 (3.8) – 2 447
TOTAL 99 832 (100) 245 645 (100) + 145 813

Looking first at the row providing the “TOTAL” amounts of tweets for both elections, we can see that the traffic more than doubled in 2014 when compared to 2010 – from 99 832 tweets during the month leading up to the former election to 245 645 tweets during the same time period four years later. This growth was perhaps to be expected, given the overall increase of media coverage devoted to Twitter, as well as the more modest increase – but still an increase – in actual Twitter use. A change that was less expected was the shift regarding the most common form of tweets sent. In 2010, just over sixty per cent of tweets were undirected – tweets sent without any intended recipient.  In 2014, retweets – redistributed messages originally sent by some other user – make up for about the same percentage level, effectively becoming the most common type of tweet sent. For @replies, signalling discussions on the platform at hand, we see an increase in numbers of such messages sent from the 2010 to the 2014 period. Looking at percentages, however, these numbers indicate a distribution diminished by almost half, decreasing from seven per cent in 2010 to just under four per cent in 2014.

So what does this all mean? One initial, tentative interpretation goes as follows. The dominance of undirected messages during the 2010 election period would seem to indicate a ‘megaphone’-like application of the service at hand. In other words, Twitter was here used primarily in order to ‘get the message out’ rather than for interaction or dialogue. The prevalence of retweets in the 2014 sample suggests that such practices might have changed. Perhaps due to the increased use levels of social media by political actors – a tendency which is sometimes discussed in relation to the overarching idea of political professionalization processess – the results presented above could be an indicator that such actors (and those similar to them) are successful in assessing the viral qualities of the platform. Plenty of retweets means plenty of spread for your message. Indeed, the patterns discussed here do not reveal which users enjoyed the most retweets. Initial data analysis regarding is coming up in a couple of days.

Comparing Functionalities of Twitter and Facebook

I’m currently working on a series of studies dealing with the upcoming Swedish elections. This also sees a shift on my behalf with regards to the empirical focus of my work – while I have been doing research on the political uses of both Twitter and Facebook, my current projects involves a comparative aspect between the two. What follows is a draft of sorts, a way for me to try and gather my thoughts on how to approach the two services from an empirical, comparative perspective. Does this make sense? Any type of feedback would be most welcome, either as a comment or as an email.

Compare Twitter and Facebook


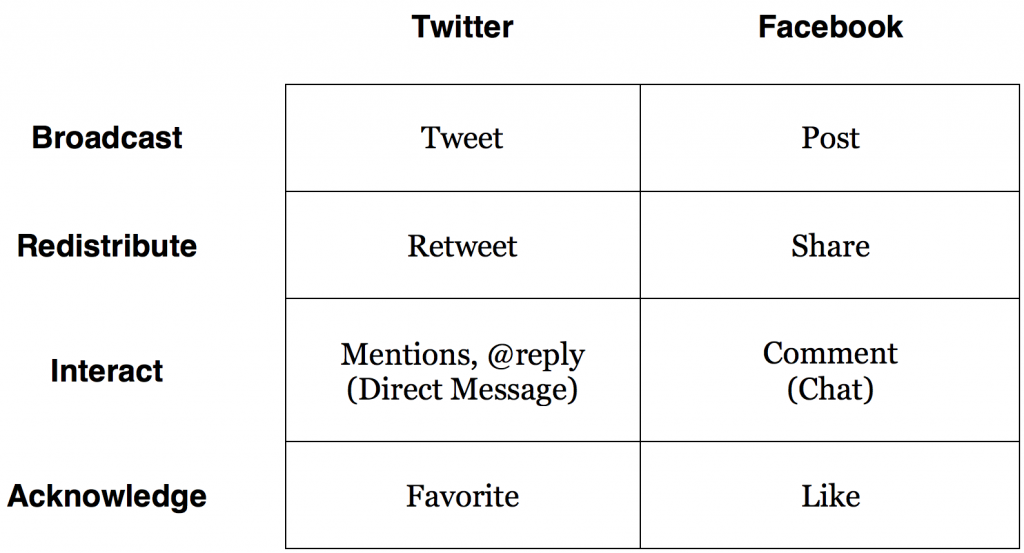
Broadcasting, redistributive, interactive and acknowledging functionalities of Twitter and Facebook

While Twitter and Facebook are often seen as similar in terms of their usage, they are distinctly different in terms of their respective technical infrastructures, service appearance and terminology (boyd and Ellison, 2008). Nevertheless, the argument is made here that the end user of both services are faced with a series of options for usage that are somewhat similar in that they offer comparable modes of communication. The four modes – Broadcasting, Redistributing, Interacting and Acknowledging – and their distinctive counterpart on each platform is presented in the figure above.

First, the very basic notion of Broadcasting entails the act of simply sending a message to a network of followers on either service. While social media uses are sometimes suggested to have moved beyond such largely one-way practices (Honeycutt and Herring, 2009), the Broadcasting variety of social media activity is still very much common at the hands of politicians up for election.

Second, much as Twitter users can employ the retweet functionality to Redistribute a tweet sent by some other user, so can a Facebook user choose to share posts made by others – such as political parties. Indeed, the potential spread of the redistributed message is dependent on a multitude of factors – individual user security settings, platform characteristics, previous choices made et c. (Bucher, 2012). Nevertheless, from the perspective of those actors whose messages are being redistributed in retweets or shares, this type of feedback is very attractive. It allows for their dispatches to potentially spread beyond their own networks, reaching the attractive status of ‘gone viral’ (Klinger and Svensson, 2014).

Third, while Interaction has been pointed to as the defining character of the Internet, uptake of such practices among politicians and parties has been mostly slow and hesitant (Stromer-Galley, 2000, 2014), indicative of the risk of exposure and embarrassment taken when interacting as a politician (Marcinkowski and Metag, 2014). Be that as it may, the functionalities for contacting and commenting are by now a commonplace feature on each platform. For Twitter, the practice of mentioning another user by including their user name somewhere in the body of a tweet signals interaction, perhaps especially so when that mention comes in the form of an @reply, where the user addressed is mentioned at the beginning of the tweet (Twitter, 2014). Morover, both platforms offer more private settings for interaction in the form of Twitter’s Direct Messages and the Chat functionality available on Facebook. These are shown in parentheses in the figure so as to indicate their less than public nature. While citizens might not choose to engage in discussion with political actors in these ways, leaving room instead for the established “Twitterati” (Bruns and Highfield, 2013), gaining comments and @replies can be seen as indicative of having an interesting (or controversial, or both) message to convey – a message yielding reactions in terms of attempted interaction initiated by social media users.

Finally, while Acknowledging features like favorite marking a tweet or liking a Facebook post are perhaps best described along the lines of “clicktivism” (Karpf, 2010) or “slacktivism” (Morozov, 2011), the exact role of these measurements in deciding the influence of a specific user or post on either studied platform remains somewhat unclear. While the sharing or retweeting of posts and tweets are arguably more important for the coveted viral effects to occur (Socialbakers, 2013), the tracking of likes and favorites are nevertheless of interest for our current purposes as they allow us to track the different ways that Twitter and Facebook is employed in the current setting.

In closing, while the procedural definitions of the terms associated with each service might be clear, the current model cannot make any inroads with regards to what these practices entail to each specific user. For example, a retweet might indicate an expression of support for one user, while others may have ascribed different or even fluctuating meaning to this or any of the other practices discussed above (Driscoll and Walker, 2014; Lomborg and Bechmann, 2014). As such, the aggregated view championed here might not be able to delve into these intricacies. Arguably, the approach employed is nevertheless useful, as it provides an overview of actions taken and attention given – whatever form or connotation that attention might take among those giving it.

References

boyd, d. m., & Ellison, N. B. (2008). Social Network Sites: Definition, History, and Scholarship. Journal of Computer-Mediated Communication, 13(1), 210-230.

Bruns, A., & Highfield, T. (2013). Political Networks Ontwitter. Information, Communication & Society, 16(5), 667-691.

Bucher, T. (2012). Want to be on the top? Algorithmic power and the threat of invisibility on Facebook. New Media & Society, 14(7), 1164-1180.

Driscoll, K., & Walker, S. (2014). Working Within a Black Box: Transparency in the Collection and Production of Big Twitter Data. International Journal of Communication, 8, 1745–1764.

Honeycutt, C., & Herring, S. C. (2009). Beyond Microblogging: Conversation and Collaboration via Twitter. Paper presented at the 42nd Hawaii International Conference on System Sciences, Waikoloa, Big Island, Hawaii.

Karpf, D. (2010). Online political mobilization from the advocacy group’s perspective: Looking beyond clicktivism. Policy & Internet, 2(4), 7-41.

Klinger, U., & Svensson, J. (2014). The emergence of network media logic in political communication: A theoretical approach. New Media & Society.

Lomborg, S., & Bechmann, A. (2014). Using APIs for Data Collection on Social Media. The Information Society, 30(4), 256-265.

Marcinkowski, F., & Metag, J. (2014). Why Do Candidates Use Online Media in Constituency Campaigning? An Application of the Theory of Planned behavior. Journal of Information Technology & Politics, 11(2), 151-168.

Morozov, E. (2011). The net delusion : the dark side of internet freedom. New York: Public Affairs.

Socialbakers. (2013). Understanding & Increasing Facebook EdgeRank  Retrieved August 15th, 2014, from http://www.socialbakers.com/blog/1304-understanding-increasing-facebook-edgerank

Stromer-Galley, J. (2000). On-line interaction and why candidates avoid it. Journal of Communication, 50(4), 111-132.

Stromer-Galley, J. (2014). Presidential campaigning in the Internet age. New York, NY: Oxford University Press.

Twitter. (2014). What are @replies and mentions?  Retrieved August 24, 2014, from https://support.twitter.com/articles/14023

Research In Progress – Norwegian Party Leaders on Facebook, pt. II

Where the previous post dealt with the popularity (measured as the median amounts of likes, comments and shares) of Facebook posts made by Norwegian party leaders, the current post presents the popularity of posts characterized by their content. While an exhaustive description of the themes employed for this purpose goes beyond what is presented here, it is my intention here to provide such detail – rather, to give a quick glimpse into one of my ongoing research projects. Here we go:

NO_themes1

As several of the error bars visible in this figure appear comparably larger to those reported in the previous one, the spread around the reported medians must be taken into account – especially when it comes to feedback in the form of likes, which much like in the previous figure comes up as most common across all themes. For this metric, then, posts featuring Acknowledgements (Md = 2494) – giving thanks to supporters, especially at the very end of the campaign – and those characterized as primarily focused on Critique (Md = 1881) emerge as yielding the highest amounts of likes, while the other metrics must be considered diminutive in comparison. As such, while showing gratitude towards or criticizing others appear to result in ample amounts of feedback, levels of engagement as a result of other thematic uses must be regarded as minimal in comparison. While an overarching analysis like the one performed here cannot provide a more qualitative assessment of the feedback measured, we can point to tendencies regarding what type of content, posted by politicians, that appears to resonate the most with their respective followers. As such, the findings provides some insight into what seems to “work” in an online setting – an empirical finding that is perhaps not especially conducive to the basic tenets of various normative theories of deliberation.

Research In Progress – Norwegian Party Leaders on Facebook, pt. I

In a couple of previous posts, I compared the activity popularity of Swedish and Norwegian politicians on Facebook during a time when the latter of these countries underwent a parliamentary election – the idea being to look for tendencies of so-called permanent campaigning. In the present and coming post, I have looked more closely at the Norwegian data and tried to delve into two aspects of Facebook use at the hands of politicians – first, the division of likes, comments and shares between the party leaders; second, that same division across different themes posted about. Lets look at the former of these first. The data here were collected during a one-month period leading up to the elections, held in September of 2013. Please note the comparably small median shares and comments per post – a finding that suggests a need to re-think the so-called viral potential of social media services like these (at least in the context at hand).

NO_party_leaders_three_categories

The figure gauges the median amounts of likes, comments and shares per posts made by each party leader during the specified period. The error bars visible in the figure indicate the confidence intervals (95 %) for the reported medians, suggesting considerable variations regarding these metrics – especially with regards to the median amount of likes per post. With these distributions in mind, we can nevertheless conclude that especially in terms of likes, the leaders of the three largest parties – Stoltenberg (Md = 1587), Solberg (Md = 970) and Jensen (Md = 3878) – emerge as the most popular. As such, the suggestion made by Vaccari in his study of political web sites during the 2007 French presidential elections that larger parties “usually have stronger ICT infrastructures due to their superior resources” (2008: 6) appears to hold true also in a social media context (see also Gibson and McAllister, 2014). Jensen in particular stands out – especially when it comes to the median amounts of comments and shares. Here, the leader of the right-wing populist Progress Party appears to have enjoyed comparably larger amounts of success in terms of raising discussion and leveraging the viral aspects offered by the sharing functionality.

Sources cited:
Gibson, R. K., & McAllister, I. (2014). Normalising or Equalising Party Competition? Assessing the Impact of the Web on Election Campaigning. Published before print in Political Studies
Vaccari, C. (2008). Surfing to the Elysee: The Internet in the 2007 French Elections. French Politics, 6(1), 1-22.

Popularity of Swedish politicians on Facebook

Continuing from my last post, dealing with Norwegian politicians and parties on Facebook, the current post presents data regarding the Swedish context. The graph posted here utilizes the same color scheme to make sense of the respective type of politicians visible – Black nodes equals parties, dark gray nodes show party leaders, light grey nodes denote ministers and “celebrity politicians” (e.g. van Zoonen 2005), and white nodes show activity undertaken by members of parliament without specific portfolios or indeed public profiles.

SE-shares-likes

In the previous post, we could see that Norwegian non-parliamentary parties were comparably quite popular in terms of the median amount of Likes and Shares received per post. The figure presented above suggest similar tendencies, although not as stated, for the Swedish case. Consider the node representing the Pirate Party, whose placement in the graph indicates a median of shares per post on par with major, “catch-all” parties like the Social Democrats or the Conservatives. Similarly, the finding that two of the parties in the right-wing coalition currently governing Sweden (the Liberal Party and the Centre Party) are not present in the figure could be an indication of what could be labeled as an ‘ekection year effect’ – seeing as all Norwegian parties (who underwent an election earlier this year) were present as visible in the corresponding figure. With regards to the most popular Facebook Pages, we see another tendency repeated from the Norwegian context. Much like the Progress Party appear to have produced a series of posts yielding high amounts of both Likes and Shares, so do the right-wing populist Sweden Democrats seem to enjoy a similar status in the Swedish context. However, when one considers the change of scale on the vertical axis, representing the median of shares per post – 0-100 shares for Norway, 0-1000 shares for Sweden – the dominance of the Sweden Democrats in this regard is further affirmed. As such, far right parties appear to have succeeded in getting their message across through Facebook in both countries, while this tendency is arguably more affirmed in the Swedish context.

Research In Progress – Popularity of Norwegian politicians on Facebook

Earlier this week, I was interviewed by Norwegian Public Service Broadcaster NRK (you can see the piece here) regarding some work I have been doing on the how political actors (parties and politicians) make use of their Facebook Pages – and to what degree their activity spreads through the platform at hand. The figure below is referred to in the brief interview and I thought I’d post it here as well. Please click on the image to enlarge it if necessary.

NO-shares-likes

Black nodes represents parties, dark gray nodes denote party leaders, light grey nodes identify ministers and “celebrity politicians” (e.g. van Zoonen 2005), whereas white nodes show activity undertaken by members of parliament without specific portfolios or indeed public profiles. Each actor is identified with name and party abbreviation. The vertical axis represent the median number of Shares per post by the identified actors, whereas the vertical axis shows the median number of Likes per post.

Starting with the Norwegian case, the figure above finds the node representing the official party account for the right-wing populist Progress Party – as well as the node corresponding to their party leader, Siv Jensen – to be among the political actors enjoying the highest medians of likes and shares per Facebook Page Posts. Beyond these and other top actors in this regard (such as PM Jens Stoltenberg), all political party accounts save for two (Socialist Left and Christian Democrats) are positioned above the horizontal dividing line, indicating the apparent popularity of official party accounts. As for the two parties below the aforementioned middle line, these are both small parties in terms of voter share. This suggested relationship between ballot recognition and Facebook Page post popularity is perhaps particularly interesting when considering the case of the Socialist Left Party. From another analysis – not published here – we could tell that while their official party account produced the highest yield of Page posts during the studied period, the figure above shows that their reach in terms of Likes and Shares was comparably limited. As a small Party, albeit with seats in government and a role as incumbents going into the 2013 elections, the Socialist Left Party appears to have had some difficulty in getting their messages across on Facebook.

This finding on the activities of an incumbent but small party on the left side of the Norwegian political spectrum can be contrasted with the spread that other accounts, operated by somewhat similar parties, appear to have enjoyed. Consider the nodes representing The Green and Red Parties in the figure above – both without representation in parliament. As visible here, these parties appear to have hosted comparably popular Facebook Pages, resulting in corresponding nodes placed in the middle of the figure. Taken together, this would seem to indicate that while party size appears to hold explanatory power regarding the online coverage enjoyed by parties, smaller, non-imcumbent parties are indeed able to get their message across on Facebook.

In a couple of days, I’ll post results regarding the popularity of Swedish politicians on Facebook. Stay tuned!


Stortinget på Twitter

I morse deltog jag i norsk radio – närmare bestämt P2 Kulturnytt, sändningen kl. 08.05 (min del är tillgänglig här som mp3-fil). I inslaget diskuterar jag några av de fynd jag kommit fram till när det gäller hur norska partiledare i Stortinget använt sig av Twitter under pågående valkampanj – mellan 1 augusti ocb 1 september. Nedan återfinns då några av de grafer och figurer som jag refererar till under inslaget. Först: ett stapeldiagram som visar hur många tweets – och vilken typ av tweets – som partiledarna skickat under den månadslånga perioden.


130905-Twitter-Stapeldiagram

Den partiledare som tycks ha varit mest aktiv på Twitter under den senaste månaden är Audun Lysbakken från Sosialistisk Venstreparti (SV) – ett parti som kan jämföras med svenska Vänsterpartiet. Tätt därefter finner vi så Trine Skei Grande från Venstre (V) – ett parti som namnet till trots kan förstås som ett parti i samma mer socialliberala tradition som svenska Folkpartiet. Om man då försöker hitta gemensamma nämnare hos dessa två partiledare som varit mest aktiva så kan man peka på att de båda leder relativt små partier – som sådana får de eventuellt svårare att få utrymme i de etablerade medierna. Då kan sociala medier som Twitter fungera som en kanal för att få ut sina budskap. Allra minst tweets skickades av Siv Jensen från Fremskrittspartiet (Frp) – ett parti som med svenska ögon sett påminner lite om det högerpopulistiska Ny Demokrati som satt i Sveriges Riksdag på 90-talet. Jensens begränsade närvaro här är inte helt oväntad – man har från partiet förklarat att Facebo0k, och inte Twitter, ska prioriteras när det gäller bruket av sociala medier.

Överlag är det slående hur kommunikativa partiledarna tycks vara – vi kan då fokusera på de grå staplarna som indikerar antalet riktade meddelanden (inleds med “@användarnamn”) – som partiledarna har skickat. Just denna typ av tweets tycks ligga i topp för samtliga politiker här utom Jensen.

Nästa graf är en nätverkskarta som visar vilka det är som poltikerna har skickat sådana @-meddelanden till under den senaste månaden. Klicka på bilden för en större version.

130905-Twitter-Nätverkskarta


Figuren visar på tydliga kluster kring var och en av partiledarna: exempelvis ser vi tidigare nämnde Lysbakken längst upp i bild. De linjer som går mellan de olika klustren visar på den eventuella kontakt som finns mellan varje politiker och de personer som andra politiker twittrat med – ett slags mått på hur pass ofta man på Twitter anropar någon utanför sitt eget kluster, om man så vill. I mitten finner vi kontot Spdama – som tillhör Liv Signe Navarsete, partiledare för Senterpartiet. Just mittenplaceringen för denna partiledare tyder på kommunikationsmönster som sträcker sig utanför det egna klustret – något som också indikeras av de linjer som utgår från Navarsetes gröna kluster. Längst ner till höger i bild finner vi kontot som tillhör tidigare nämnda Siv Jensen. Avståndet från resten av politikerna, samt det faktum att inga linjer finns dragna från Jensens konto till hennes partiledarkollegor kan ses som symptomatiskt på dels den berøringsangst som finns kring Frp hos övriga norska partier – de är populära bland väljarna, men anses som kontroversiella bland de flesta andra partier. Det kan också relateras till den tidigare nämnda prioriteringen av Facebook för just detta parti.

Research In Progress – Social Media Adoption in Government, Part II

Here, then, is the follow up post to my previous post on the paper I am currently working on together with Bente Kalsnes, regarding social media adoption and uses by Swedish and Norwegian politicians. In the last post, I presented the adoption rates for Twitter and Facebook Pages for our sample of politicians. Below, a series of luxurious greyscale box-and-whiskers plots provides some insights into the actual uses of these services by those elected to serve in the Swedish and Norwegian Parliaments respectively. Specifically, the scales on the y axis represent the number of tweets (upper row, grey boxes) or Facebook posts (lower row, white boxes) that the politicians had sent per day since they created an account on each service.

130902-boxplots


To begin with, a note on interpretation. Box-and-whiskers plots provide a visual overview the distribution of specified numeric variables. First, the ‘whiskers’ inform us about the spread of the data – indicating the lowest and highest data points. Any case – here, politician – found outside the whiskers is considered an outlier – here, a politician who stands out in his or her comparably extreme high-frequent use of social media. Second, for the ‘boxes’, the lines visible within them indicates the median of the distribution. Given the nonparametric distribution of the data, the median was determined as a suitable statistic. The areas in-between the whiskers, the box edges and the median line altogether allow us to discern the quartiles of each distribution – which in turn is helpful when assessing the skew of the analyzed data.

With these guidelines for interpretation in place, a few results stand out. First, for Twitter (upper row of the figure, grey boxes), the median values for both countries indicate that politicians tend to send out under one tweet per day (NO = 0.60 tweets, 0.95 tweets in Sweden). Compared to the means of tweets per day, these are considerably higher in both countries (NO = 1.01, SE = 2.85), suggesting a skewed distribution where comparably few politicians account for a large amount of tweets being sent. The same tendency can also be discerned when noting the slight upward skew of the boxes for both countries. Particularly for Sweden, this upward skew, indicating the activity of high-end users, is complemented by a series of outlier values – politicians who, due to their frequent use of the service at hand, appear to be literally ‘off the charts’ when compared to their colleagues. In both countries, these politicians could be described as “mid-level” with regards to their respective roles in parliament – while there are exceptions, particularly in the Swedish case (such as Annie Lööf or Birgitta Ohlsson), these outliers can largely be identified as members of parliament without specified ministerial duties or other, similar tasks usually associated with important work portfolios ascribed to them.

Second, for Facebook data (lower row, white boxes), the difference in scale as detailed on the Y-axis is striking when compared to our results regarding Twitter activity – while the former scale ranges from 0-40 tweets per day, the Page activity of the politicians in our sample can fit comfortably within a scale of 0-4 posts per day. This very basic results provides us with some initial insights into everyday uses of this particular service at the hands of politicians – a mode of communicating that is arguably not characterized by abundance. According to our findings, Norwegian politicians tended to provide a median of 0.28 Facebook Page posts per day (Mean = 0.36), with that same statistic for Sweden amounting to 0.11 posts per day (Mean = 0.26). While the middle boxes are still skewed upwards, they appear more evenly distributed around the median line in comparison with the Twitter data, indicating a comparably limited spread around the reported median for both countries – a claim that seems especially valid for Norway. Furthermore, as the medians and means are relatively closer to each other for the Page activity variable than for its Twitter counterpart, we can conclude that while Twitter activity is more abundant and characterized by upward skews on the scale caused by highly active politicians, Facebook Page activity appears as rather limited – a result that is further corroborated by the fact that the number of outliers for the latter of these scales are rather limited in comparison with the former. In comparison with the “mid-level” politicians found in our results pertaining to Twitter, the outliers in terms of Page activity tend to be top-level politicians – Siv Jensen is the leader of the Progress Party in Norway, while Jonas Sjöstedt leads the Swedish Left Party.