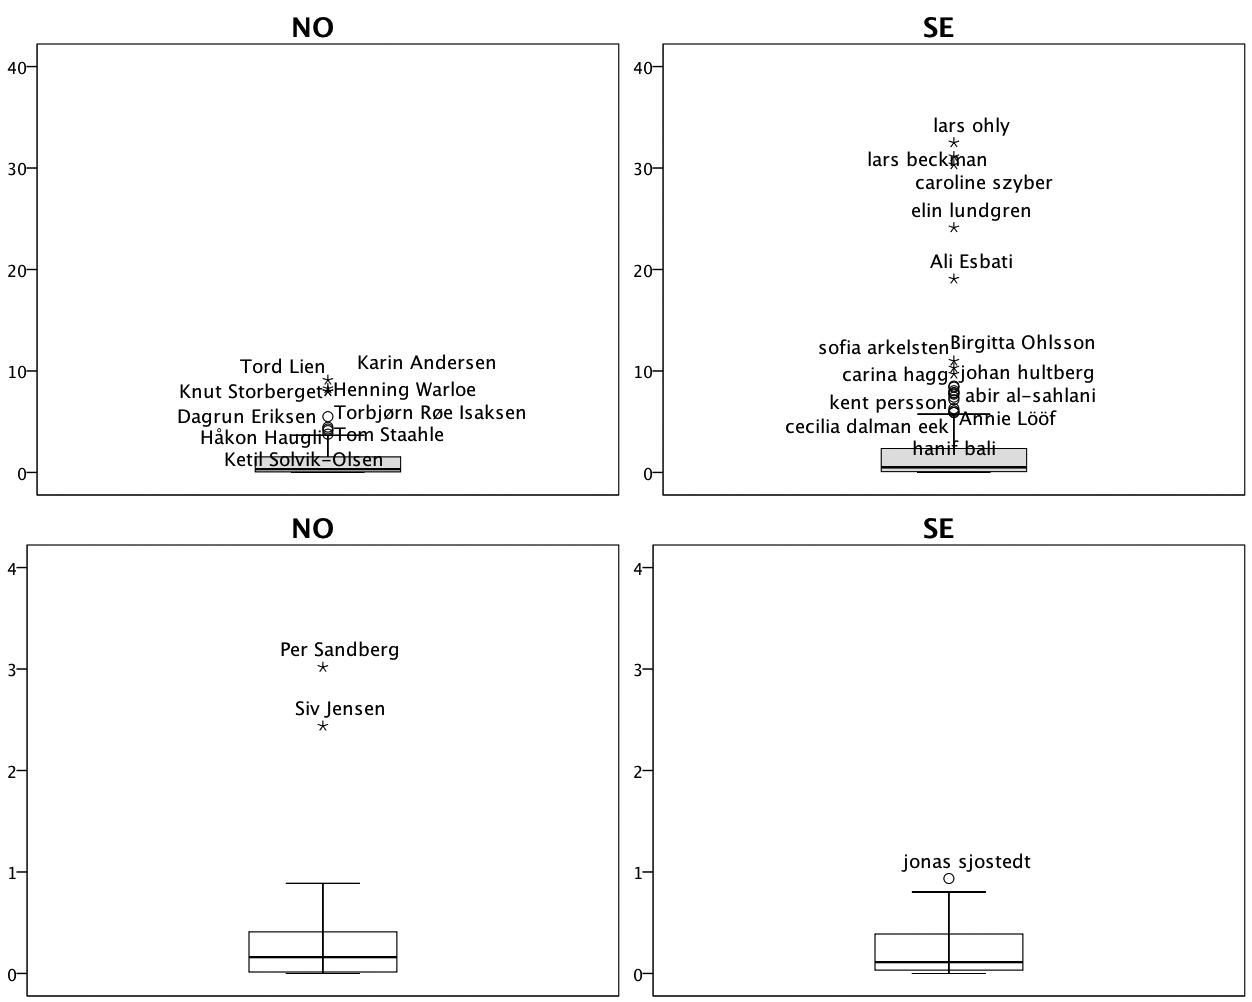
Here, then, is the follow up post to my previous post on the paper I am currently working on together with Bente Kalsnes, regarding social media adoption and uses by Swedish and Norwegian politicians. In the last post, I presented the adoption rates for Twitter and Facebook Pages for our sample of politicians. Below, a series of luxurious greyscale box-and-whiskers plots provides some insights into the actual uses of these services by those elected to serve in the Swedish and Norwegian Parliaments respectively. Specifically, the scales on the y axis represent the number of tweets (upper row, grey boxes) or Facebook posts (lower row, white boxes) that the politicians had sent per day since they created an account on each service.
To begin with, a note on interpretation. Box-and-whiskers plots provide a visual overview the distribution of specified numeric variables. First, the ‘whiskers’ inform us about the spread of the data – indicating the lowest and highest data points. Any case – here, politician – found outside the whiskers is considered an outlier – here, a politician who stands out in his or her comparably extreme high-frequent use of social media. Second, for the ‘boxes’, the lines visible within them indicates the median of the distribution. Given the nonparametric distribution of the data, the median was determined as a suitable statistic. The areas in-between the whiskers, the box edges and the median line altogether allow us to discern the quartiles of each distribution – which in turn is helpful when assessing the skew of the analyzed data.
With these guidelines for interpretation in place, a few results stand out. First, for Twitter (upper row of the figure, grey boxes), the median values for both countries indicate that politicians tend to send out under one tweet per day (NO = 0.60 tweets, 0.95 tweets in Sweden). Compared to the means of tweets per day, these are considerably higher in both countries (NO = 1.01, SE = 2.85), suggesting a skewed distribution where comparably few politicians account for a large amount of tweets being sent. The same tendency can also be discerned when noting the slight upward skew of the boxes for both countries. Particularly for Sweden, this upward skew, indicating the activity of high-end users, is complemented by a series of outlier values – politicians who, due to their frequent use of the service at hand, appear to be literally ‘off the charts’ when compared to their colleagues. In both countries, these politicians could be described as “mid-level” with regards to their respective roles in parliament – while there are exceptions, particularly in the Swedish case (such as Annie Lööf or Birgitta Ohlsson), these outliers can largely be identified as members of parliament without specified ministerial duties or other, similar tasks usually associated with important work portfolios ascribed to them.
Second, for Facebook data (lower row, white boxes), the difference in scale as detailed on the Y-axis is striking when compared to our results regarding Twitter activity – while the former scale ranges from 0-40 tweets per day, the Page activity of the politicians in our sample can fit comfortably within a scale of 0-4 posts per day. This very basic results provides us with some initial insights into everyday uses of this particular service at the hands of politicians – a mode of communicating that is arguably not characterized by abundance. According to our findings, Norwegian politicians tended to provide a median of 0.28 Facebook Page posts per day (Mean = 0.36), with that same statistic for Sweden amounting to 0.11 posts per day (Mean = 0.26). While the middle boxes are still skewed upwards, they appear more evenly distributed around the median line in comparison with the Twitter data, indicating a comparably limited spread around the reported median for both countries – a claim that seems especially valid for Norway. Furthermore, as the medians and means are relatively closer to each other for the Page activity variable than for its Twitter counterpart, we can conclude that while Twitter activity is more abundant and characterized by upward skews on the scale caused by highly active politicians, Facebook Page activity appears as rather limited – a result that is further corroborated by the fact that the number of outliers for the latter of these scales are rather limited in comparison with the former. In comparison with the “mid-level” politicians found in our results pertaining to Twitter, the outliers in terms of Page activity tend to be top-level politicians – Siv Jensen is the leader of the Progress Party in Norway, while Jonas Sjöstedt leads the Swedish Left Party.